The social graph is one of the important new concepts of our time. It can be explored from page to page on Twitter or Facebook. It is very interesting for users to explore who knows who, even if you might not grasp how well they know each other. Sometimes the social graph is actually shown as an explicit graph with nodes and edges. But as people usually have 100s of contacts, it can be very hard to grasp what is shown at first glance.

The key idea behind this business idea is to display the most important contacts of a person around them in a graph structure, and then some of those peoples' more important contacts further out, to make the social graph comprehensible at first glance. The user can click on any person to move them to the center of attention, while the rest of the graph shifts to new positions, as nodes (people) fade in and out at the periphery of this user interface.
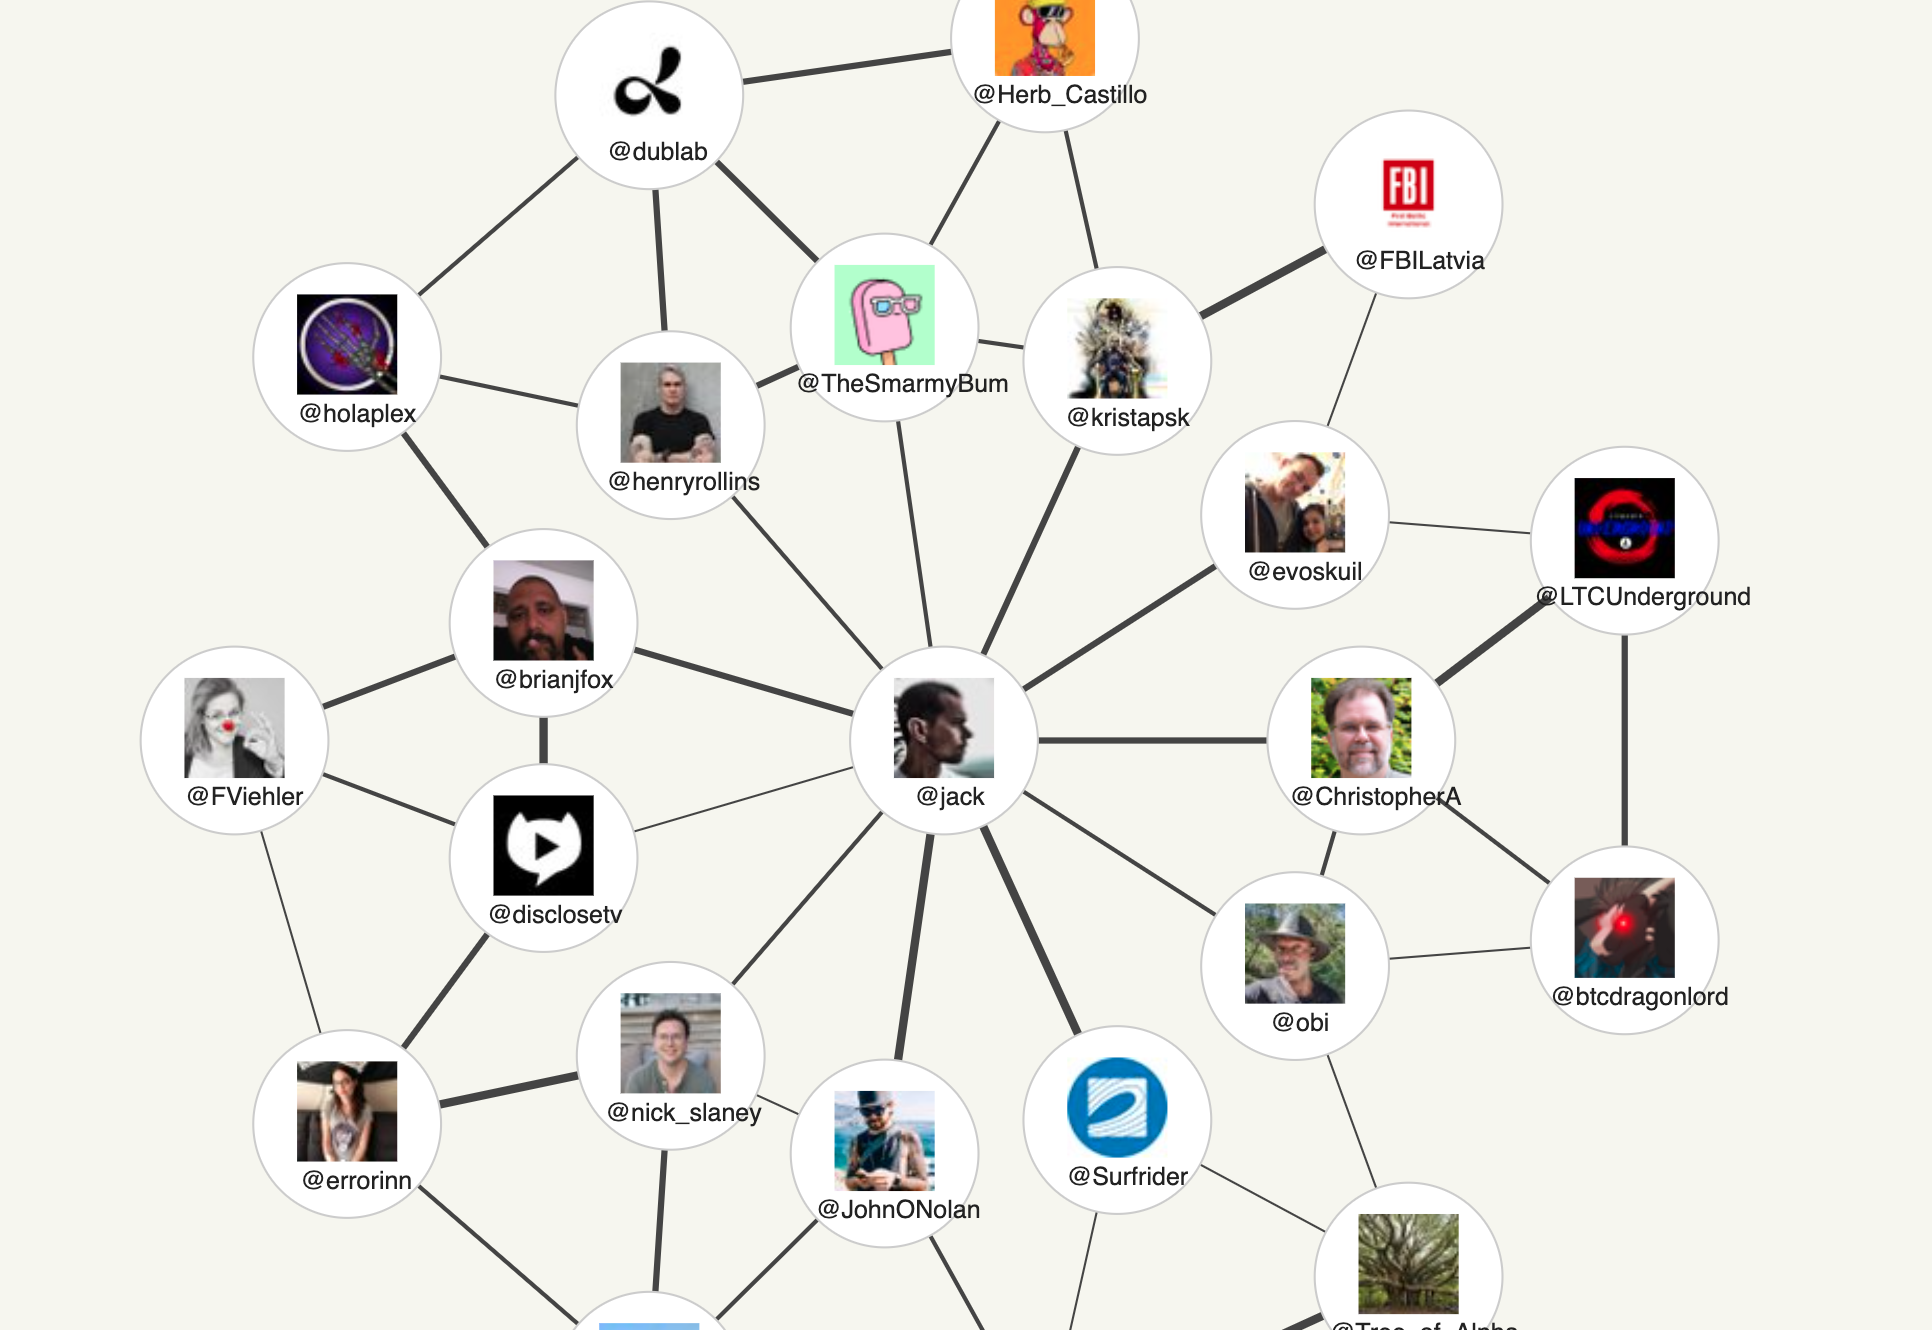
The image above shows a mockup of such an interface with real Twitter users and fake connection weights between them. Nodes in this graph consist of the user’s profile pic above their username and a link to the profile page. Edges in the graph are simple lines between these nodes, thicker or thinner, to indicate how close the people are on the social network.
By making this an interactive user interface in the browser, users could explore large parts of the social graph in explicit representation, discovering new peers quickly. An important ingredient is a good algorithmic heuristic to select the most important contacts of a user, so that the display communicates as much relevant information as possible. And while displaying the social graph is not new, an interactive system as a web product has not been done yet.
The main obstacle to make this work, is to get the data from a social network of choice. As most social networks guard their data closely, this idea would have to be conducted in collaboration with a social network. Weighting connections between people can be according to how often they interact or how many messages have been exchanged between them. Different types of social network have different variables, but they all have a social graph.
The key frontend technology to enable this idea is Javascript-animated Scalable Vector Graphics (SVG). HTML5 allows pages to be augmented by SVG graphical elements, which can be modified and moved around by code, just like regular HTML elements. This technology has been around for at least a decade now, so this idea is ripe for the picking!
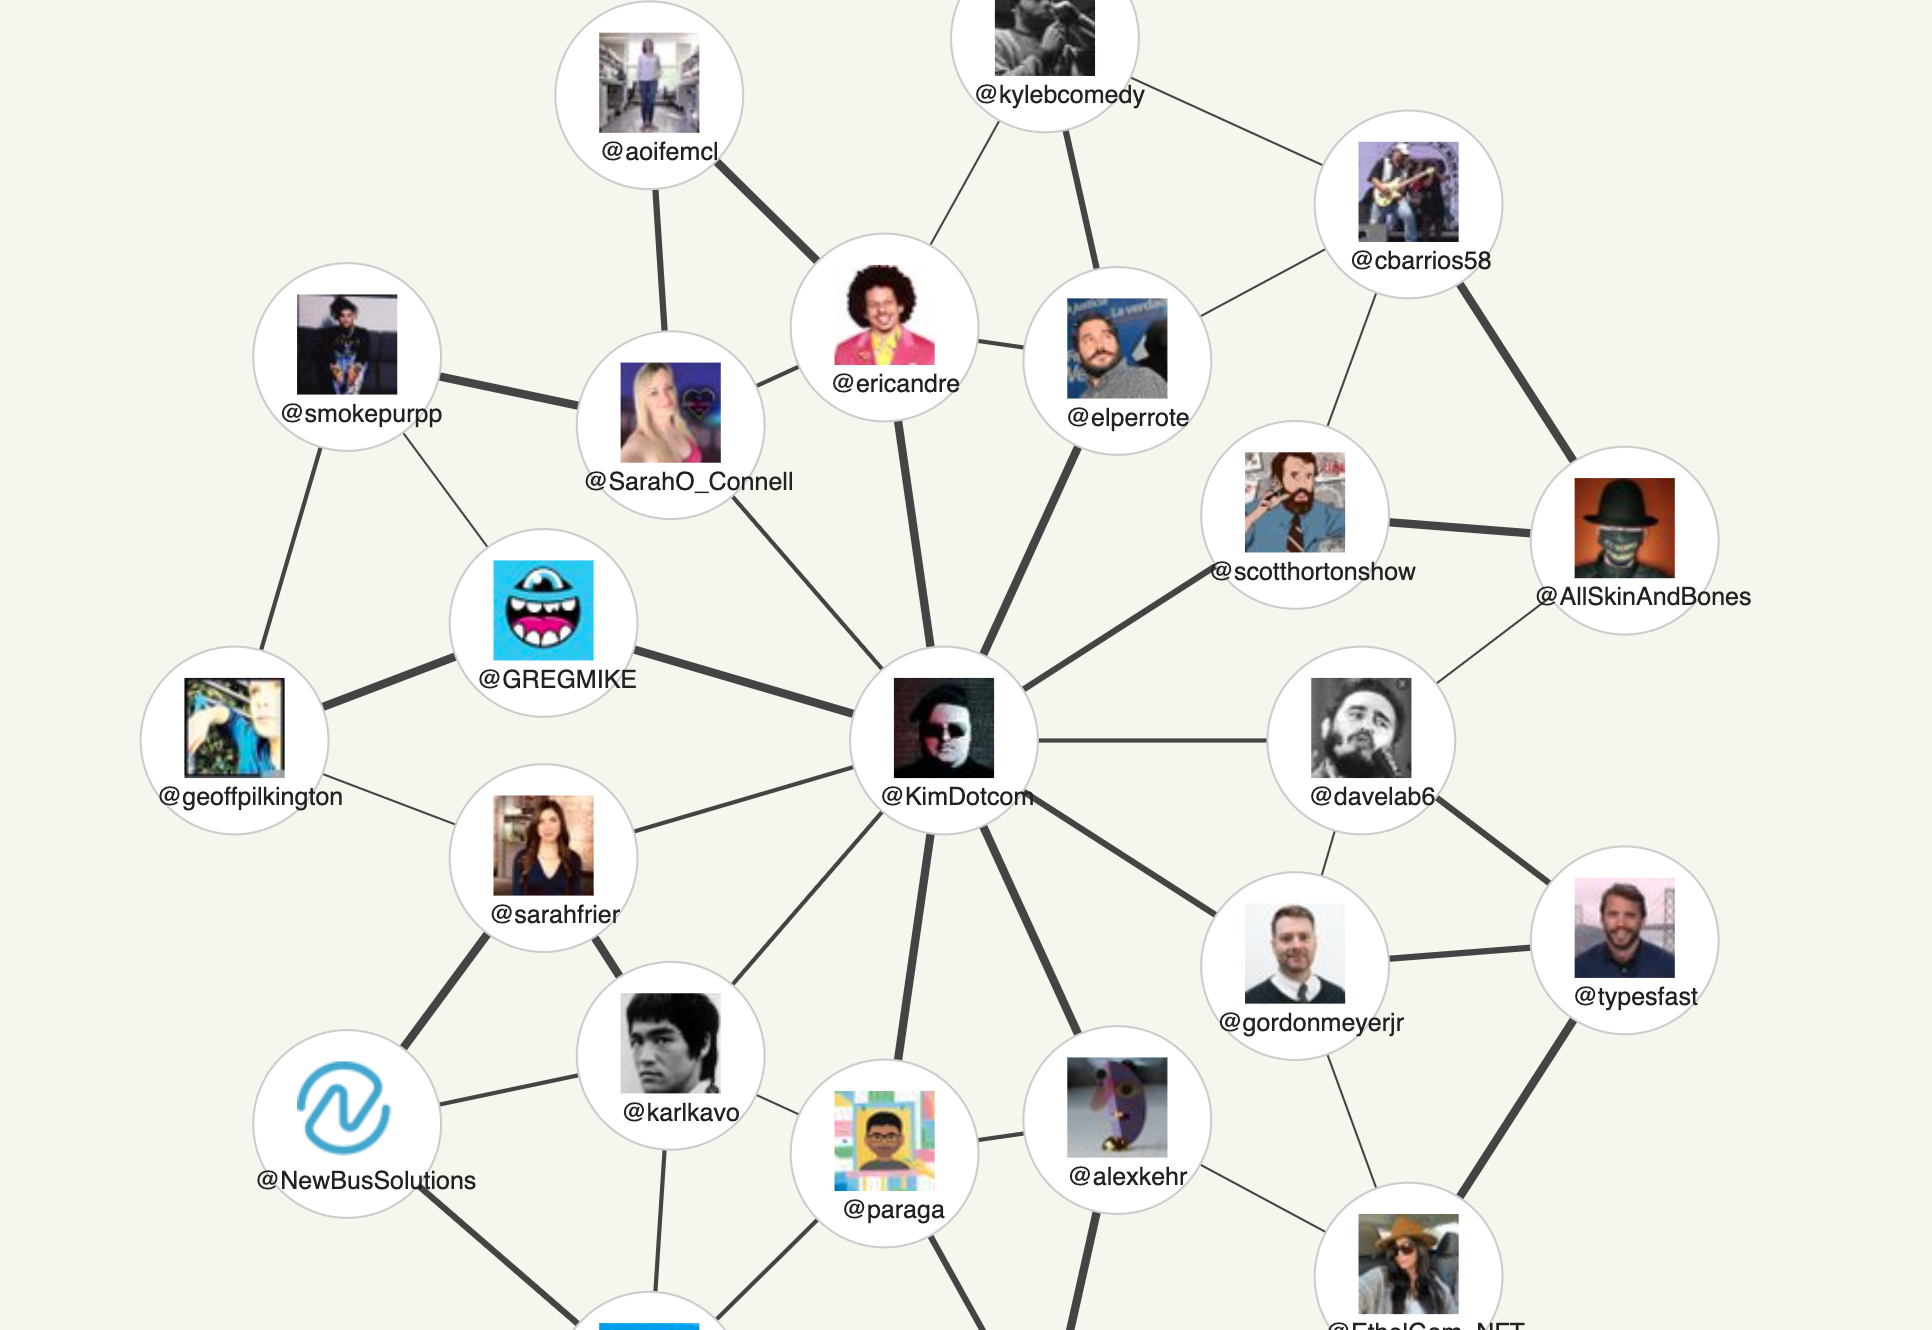
Here is another still image from the mockup:
